Start Tracking Product Usage Analytics
If you need actionable insights into on-premises software, a 30-day free trial of Revenera Usage Intelligence will empower you with genuine product usage metrics that enable you to make informed decisions.
Application usage tracking is made easy with a customizable product analytics dashboard that allows you to track user flow, monitor feature adoption, evaluate OS and hardware deployments, and more.
Sign up for the Free Trial to gain full-feature access to the industry's best product usage analytics tools, and see immediate benefit with five quick wins:
5 Quick Wins
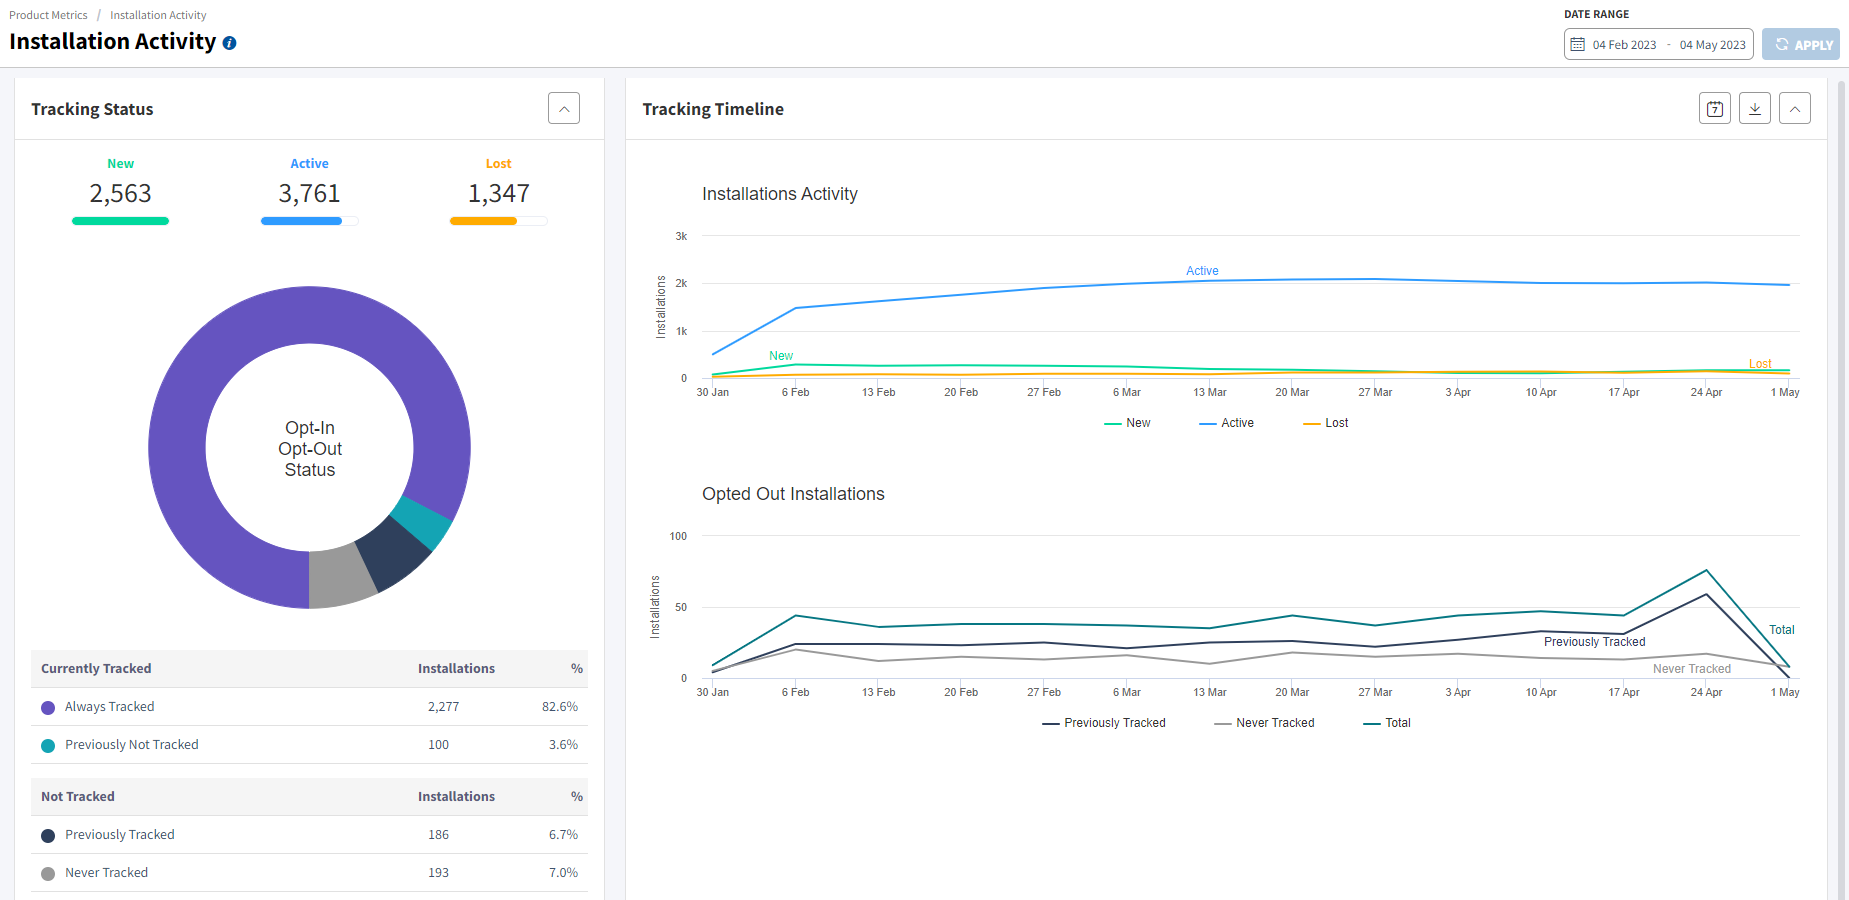
Measure Daily Engagement: Installation Activity Report
Seeing if overall activity is where you expect it to be and if users are engaged day-to-day is a powerful insight. Many software companies struggle with how to calculate product usage rate, but this powerful feature allows you to see how many users are coming onboard and how many might be abandoning your product. The product usage report is shareable across your whole organization, providing accurate insight into the health of your application and business.
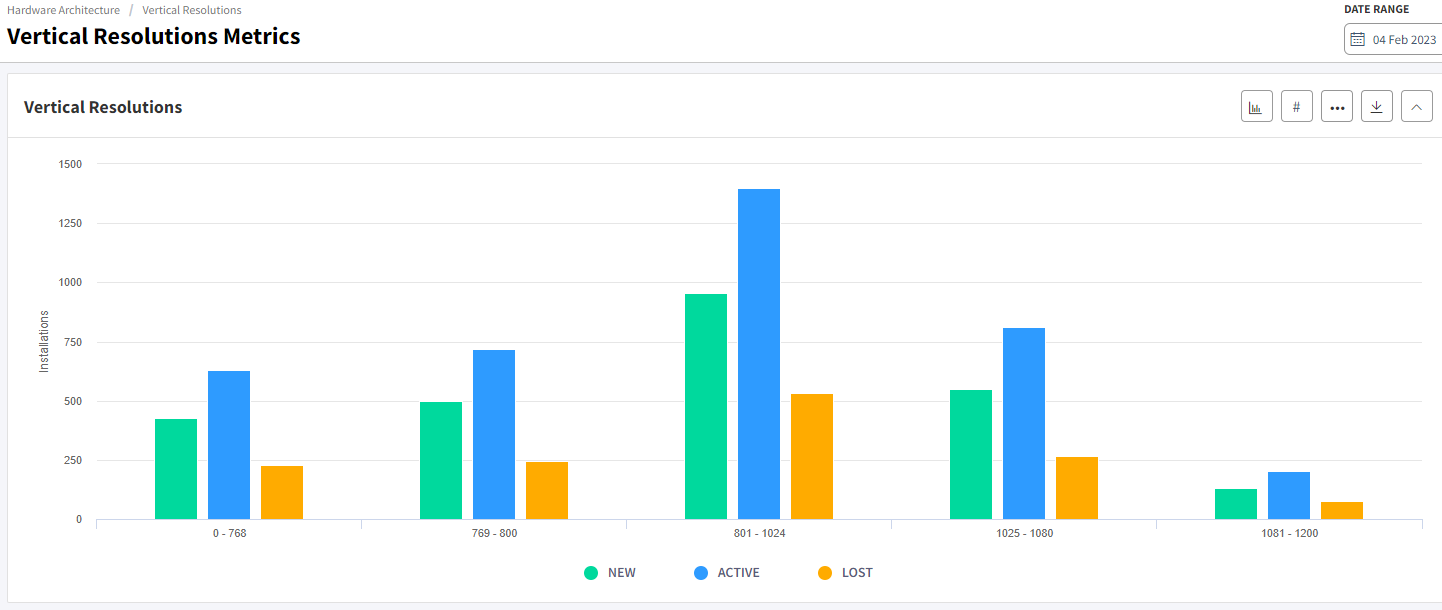
Know How Users View Your App: Screen Resolution Reports
Understanding the variations and frequency of different display settings users have provides your UI and UX team with information on what resolutions to optimize for and which aren't as widely used. When you have a resolution-dependent application such as modeling, rendering, font applications, and other graphics-intensive programs, this data is critical to deliver the best experience for the most users.
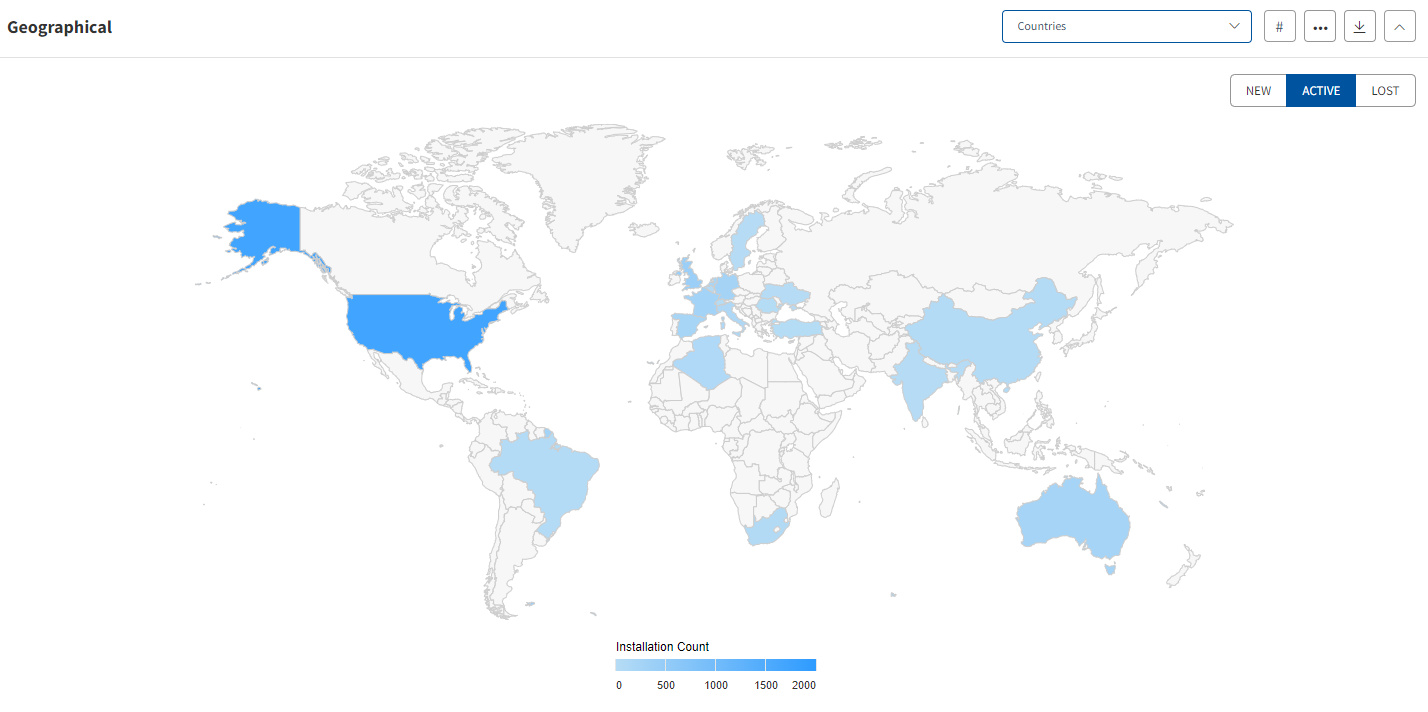
Support A Global User Base: Geographical Report
When managing a global application, you need to understand where your product is most popular, and you may even see activity in places you don't expect. This insight can help you determine when a regional customer base is large and active enough to benefit from localization.
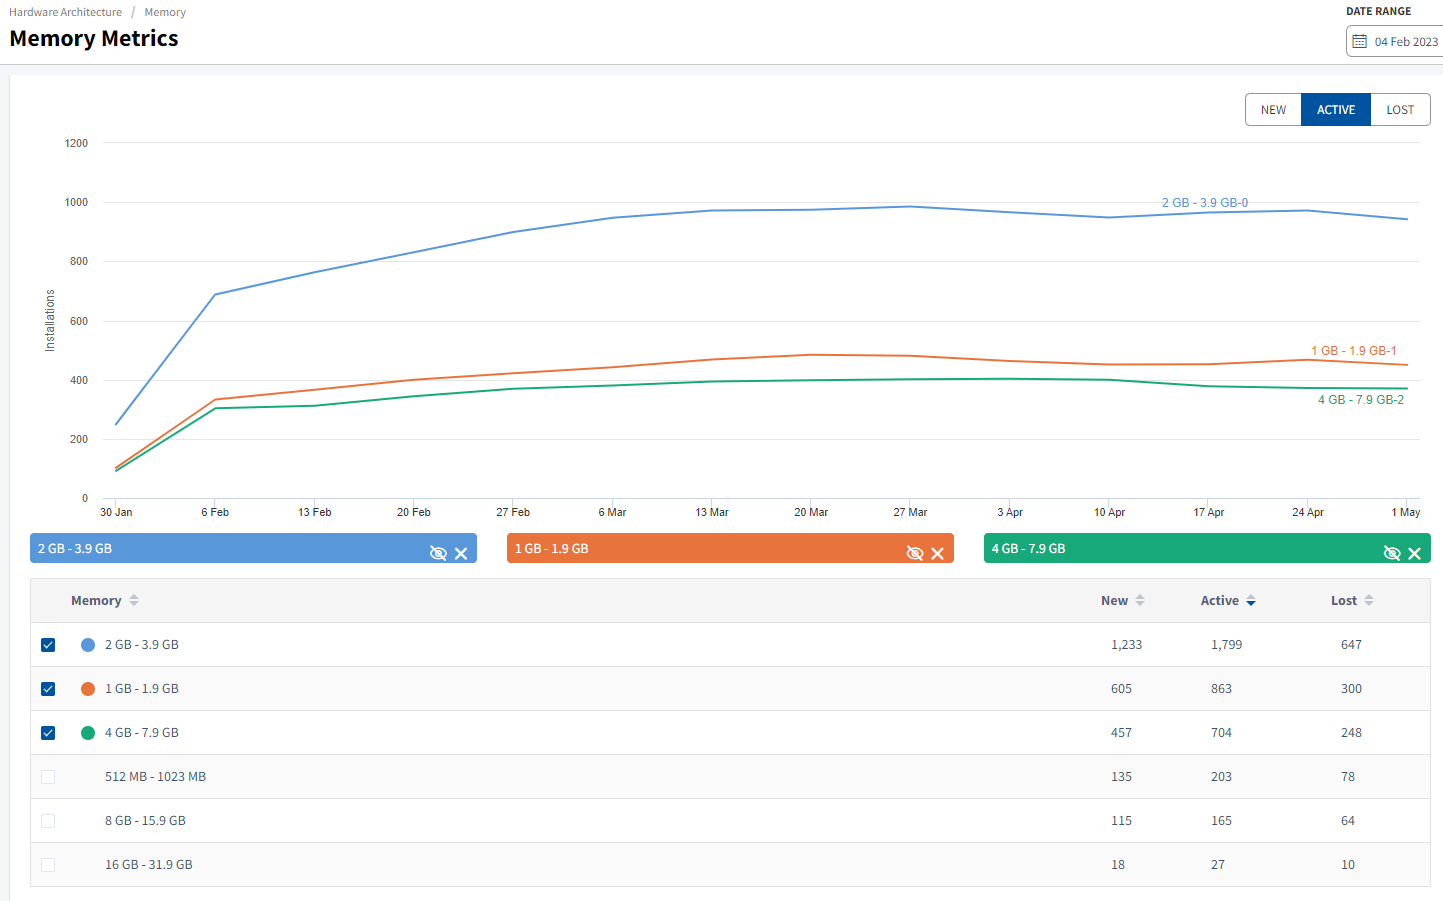
Understand Hardware Classification: Memory Report
Your users have a wide variety of hardware configurations. With product usage data, your R&D team can replicate and test these configurations in similar environments. Knowing which hardware specs to focus on when developing new features and when you can increase your minimum system requirements will help optimize time and resources.
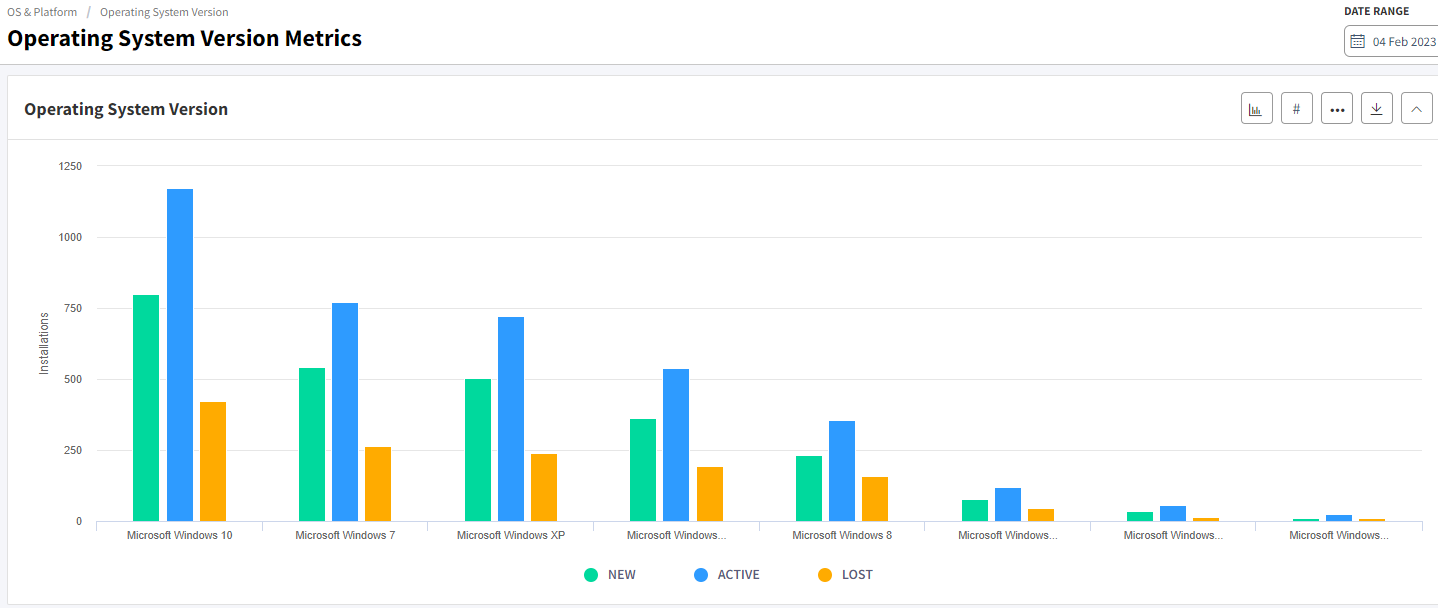
Monitor Adoption: Operating System And Platform Reports
Identify adoption rates across all OS platforms and versions. For example, if your engineering team is planning on developing new features that leverage the latest OS, you'll want to make sure the majority of your users are ready to take advantage of them. If the adoption rate doesn't line up with what you expect, you might want to adjust your roadmap accordingly.
Make Data-Driven Decisions
Gain insights on how to increase usage of a product and identify key value drivers for on-premises to SaaS transition projects with a 30-Day FREE TRIAL of this powerful product usage analytics tool.
Sign up, integrate the SDK, collect data, and start building your product usage dashboard today.
With Usage Intelligence, we can set team goals around specific usage metrics, galvanizing people from marketing, support, documentation and development to work together on hitting our targets. Usage Intelligence helps us drive coordinated effort on the customer's behalf.


